
The Default Rate Stopped Working
August 2026 | Monthly Insights
Private credit funds returned more capital than they raised in both quarters of the first half of 2026. The loans kept paying. What moved was the carrying value of the book, the cash content of the coupon and the premium over cash, and none of it shows up in a default rate.
Executive Summary
Non-traded private credit funds returned about US$12.7bn to investors over the first half of 2026, about US$6.9bn in the first quarter and about US$5.9bn in the second, against roughly US$9.7bn raised across the two quarters. Both quarters ran a net outflow. Requests exceeded the customary 5% quarterly cap at Ares, Apollo, Morgan Stanley and Blackstone, and each filled them pro rata. The straightforward explanation would be that investors were leaving because loans had stopped paying, and the data does not support that. Payment defaults remain low and on some measures are falling. Several other things did move over the eighteen months to mid-2026. Secondary spreads widened, which reduced the carrying value of every floating-rate loan whether or not the borrower was in difficulty. The policy rate stopped falling, so the coupon stopped rising. Capital rotated toward real assets. And underneath all of that, a narrow tail of loans deteriorated sharply while the reported averages improved. At Blackstone's flagship credit fund, non-accrual investments rose from 0.6% of the portfolio at cost to 2.4% in a single quarter, and the mark on the weakest 5% of the book fell twelve points over six months while the average fell less than two. An investor could see the aggregate and could not see the composition. The measures the market uses to detect stress in this asset class, and the payment default rate in particular, have stopped describing what they are being used to describe. For borrowers and sponsors in Southeast Asia the consequence is about the availability of capital rather than the quality of credit. Requests have since eased, with Blackstone reporting on 23 July that third-quarter redemptions at its flagship credit fund were down materially.
1. What the Redeemers Could See
Blackstone Private Credit Fund is the useful worked example because its disclosure is the fullest. Non-accrual investments were 0.5% of the portfolio at cost at the end of 2024 and 0.6% at the end of 2025, in line with the rest of the non-traded universe. At 31 March 2026 they were 2.4%, with the number of loans on non-accrual rising from sixteen to twenty-nine across seventeen borrowers rather than nine, and at 30 June the figure was 2.2% on manager-reported data, the second-quarter Form 10-Q being unfiled at the date of this note, so the step change has not reversed. Net unrealised depreciation widened from US$717m to US$1,884m over the same quarter, and the fund recorded a net decrease in net assets from operations of US$49.9m, its second negative quarter and the first since the spread widening of June 2022. The two credits the manager identified as driving the non-accrual increase did not drive the unrealised loss, which the cost-and-fair-value schedule shows spread across first lien, second lien and joint ventures.
The fund disclosed this on 29 April, three weeks before the second-quarter repurchase window opened. First-quarter requests had gone in earlier, against the October 2025 distribution cut, a year of falling net asset value and the software equity de-rating that ran to February 2026.
Requests then escalated. Blackstone received repurchase requests equal to 7.9% of the fund in the first quarter and 10% in the second, against a 5% cap, and filled roughly half of the second-quarter requests; net outflows were US$1.2bn against US$1bn of gross sales. The pattern was industry-wide. Second-quarter requests reached 16.8% of shares at Apollo Debt Solutions, 14.4% at Ares Strategic Income and 11.6% at Morgan Stanley's North Haven Private Income Fund, filled at 43%, while Oaktree Strategic Credit at 4.5% stayed inside its cap.
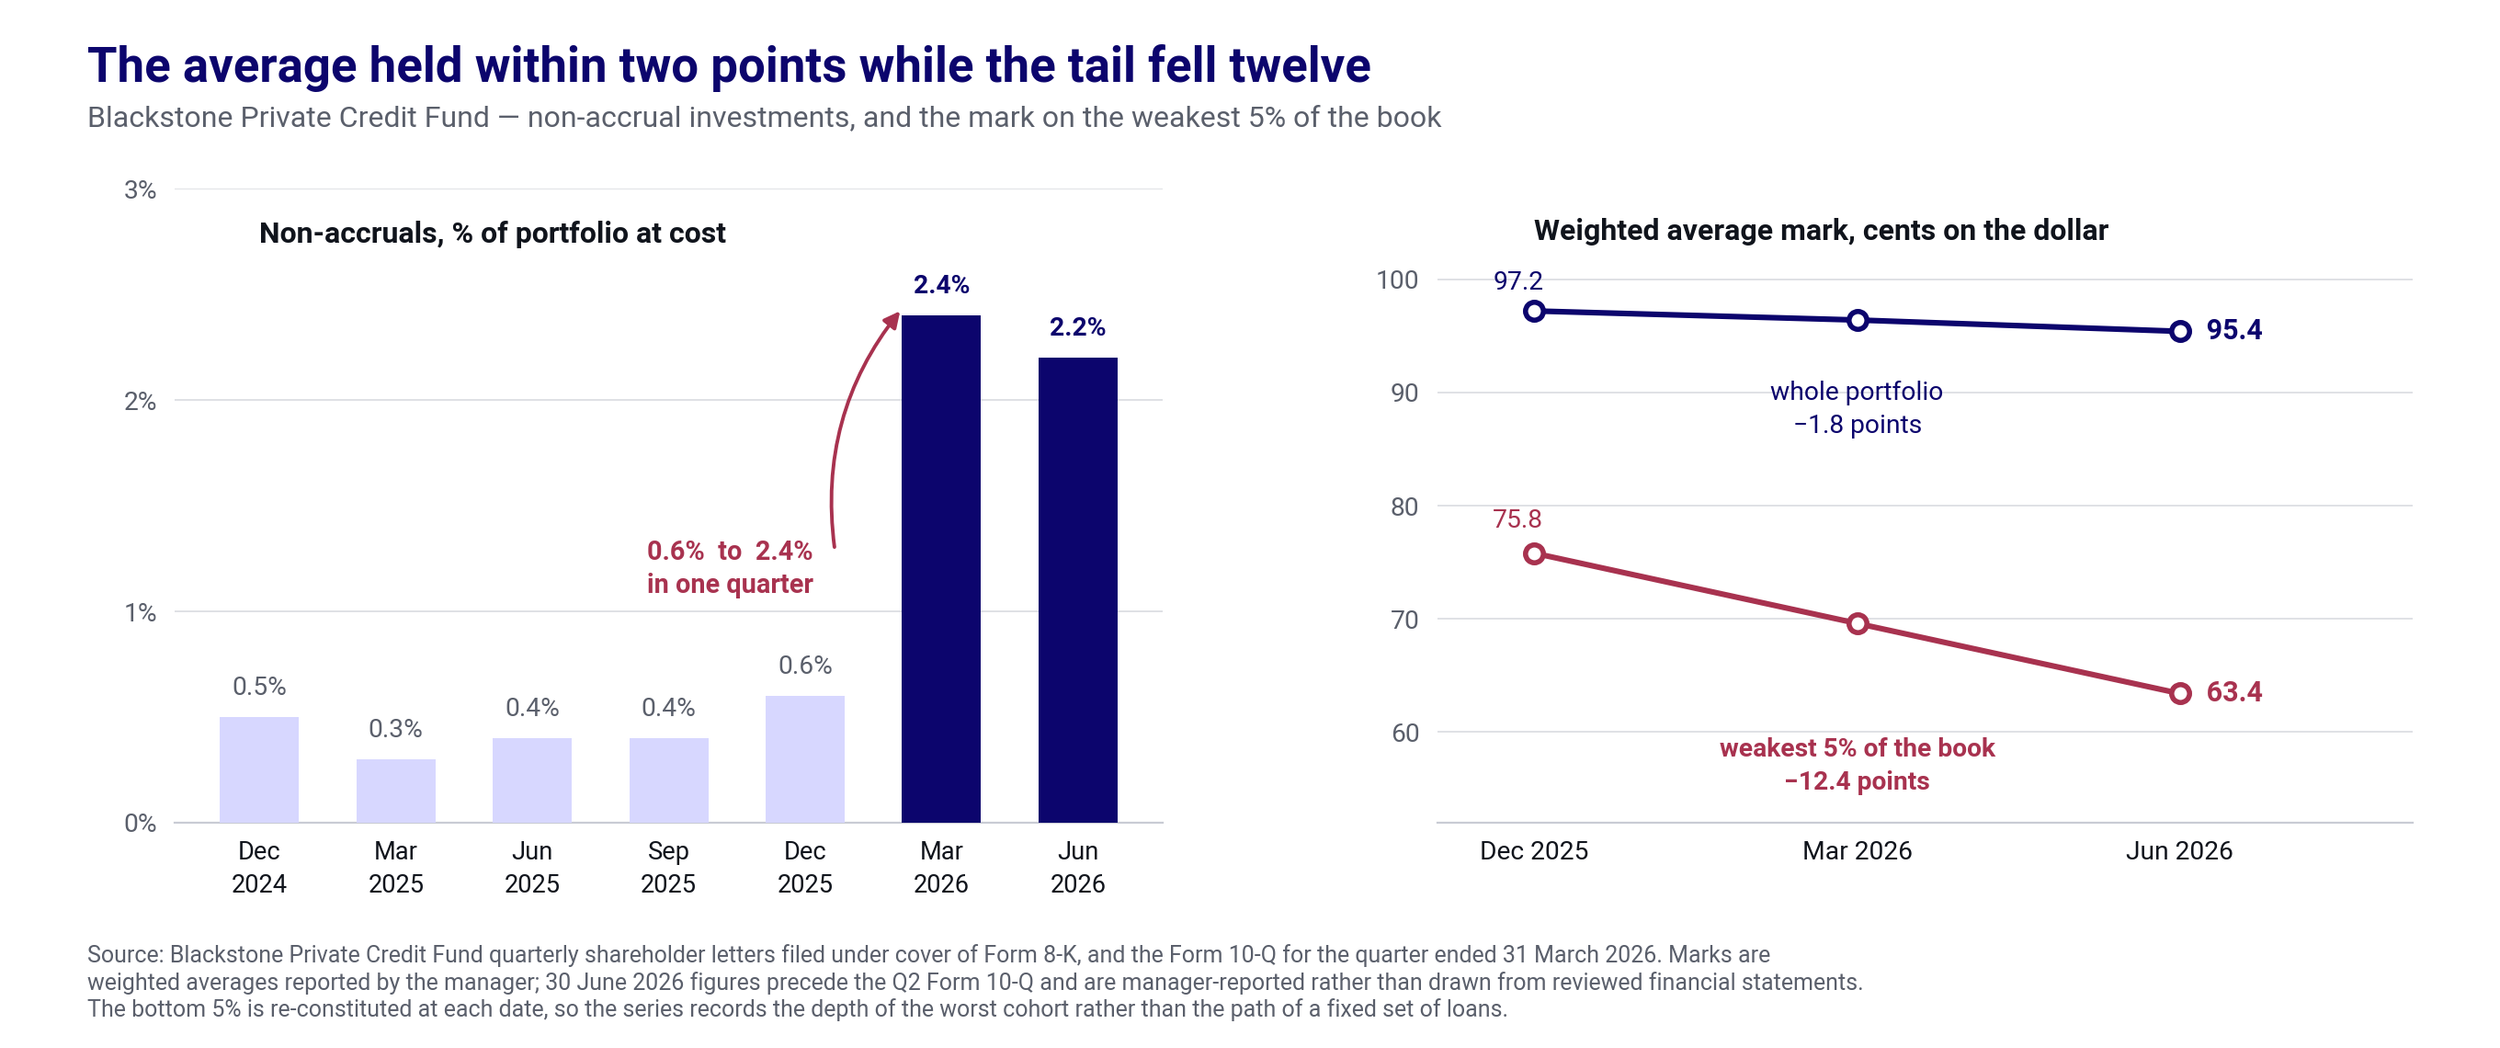
The shape of the movement carries more information than its size. The weighted average mark on the debt portfolio fell 1.8 points over six months while the mark on the weakest 5% of the book fell 12.4 points. Two qualifications belong with that. The bottom 5% is re-constituted at each measurement date, so the series records the depth of the worst cohort rather than the path of a fixed group of loans. And direct lending secondary spreads widened by 25 to 100 basis points through 2026, which on a book of this duration moves marks by one to four points on every loan, performing or not. The two series together indicate a general repricing of the whole book alongside a deepening problem in a narrow tail.
The averages were meanwhile improving for reasons worth stating precisely. Weighted average borrower EBITDA rose from US$264m to US$278m and interest coverage from 2.1 to 2.3 times. The base rate was flat across that window, since the last cut took effect in December 2025, so this is not a rate effect; the fund attributes it to portfolio-company EBITDA growth of 10% to 11% year on year. The same disclosure records roughly 7% of debt investments with interest coverage below one times. A book can grow earnings at 10% in aggregate and still have one loan in fourteen unable to service its debt from operations, and it is the second figure that determines the loss.
Not all of the money leaving was a judgement on credit. Across the half, fundraising for non-traded credit strategies fell 40% to US$32.4bn while real estate and infrastructure raised US$28.2bn, up 31%, and in the second quarter hard assets outraised credit, US$15bn against US$12.2bn. Some of the outflow is allocation moving to where the return now looks better, which no fund-level disclosure separates from a view on the loan book.
2. The Default Rate Has Stopped Being Useful
Anyone arguing about private credit quality in 2026 can find a number to support their position, because the published measures count different things. Proskauer's index of payment and covenant defaults read 2.51% in the second quarter, down from 2.73%, while Fitch's US private credit default rate read 6.0%, the highest since its series began. Both are correct. Fitch's measure is broader, and its own breakdown explains the gap: around one event in seven is a hard default, and more than half of the events it counted involved maturity extensions.
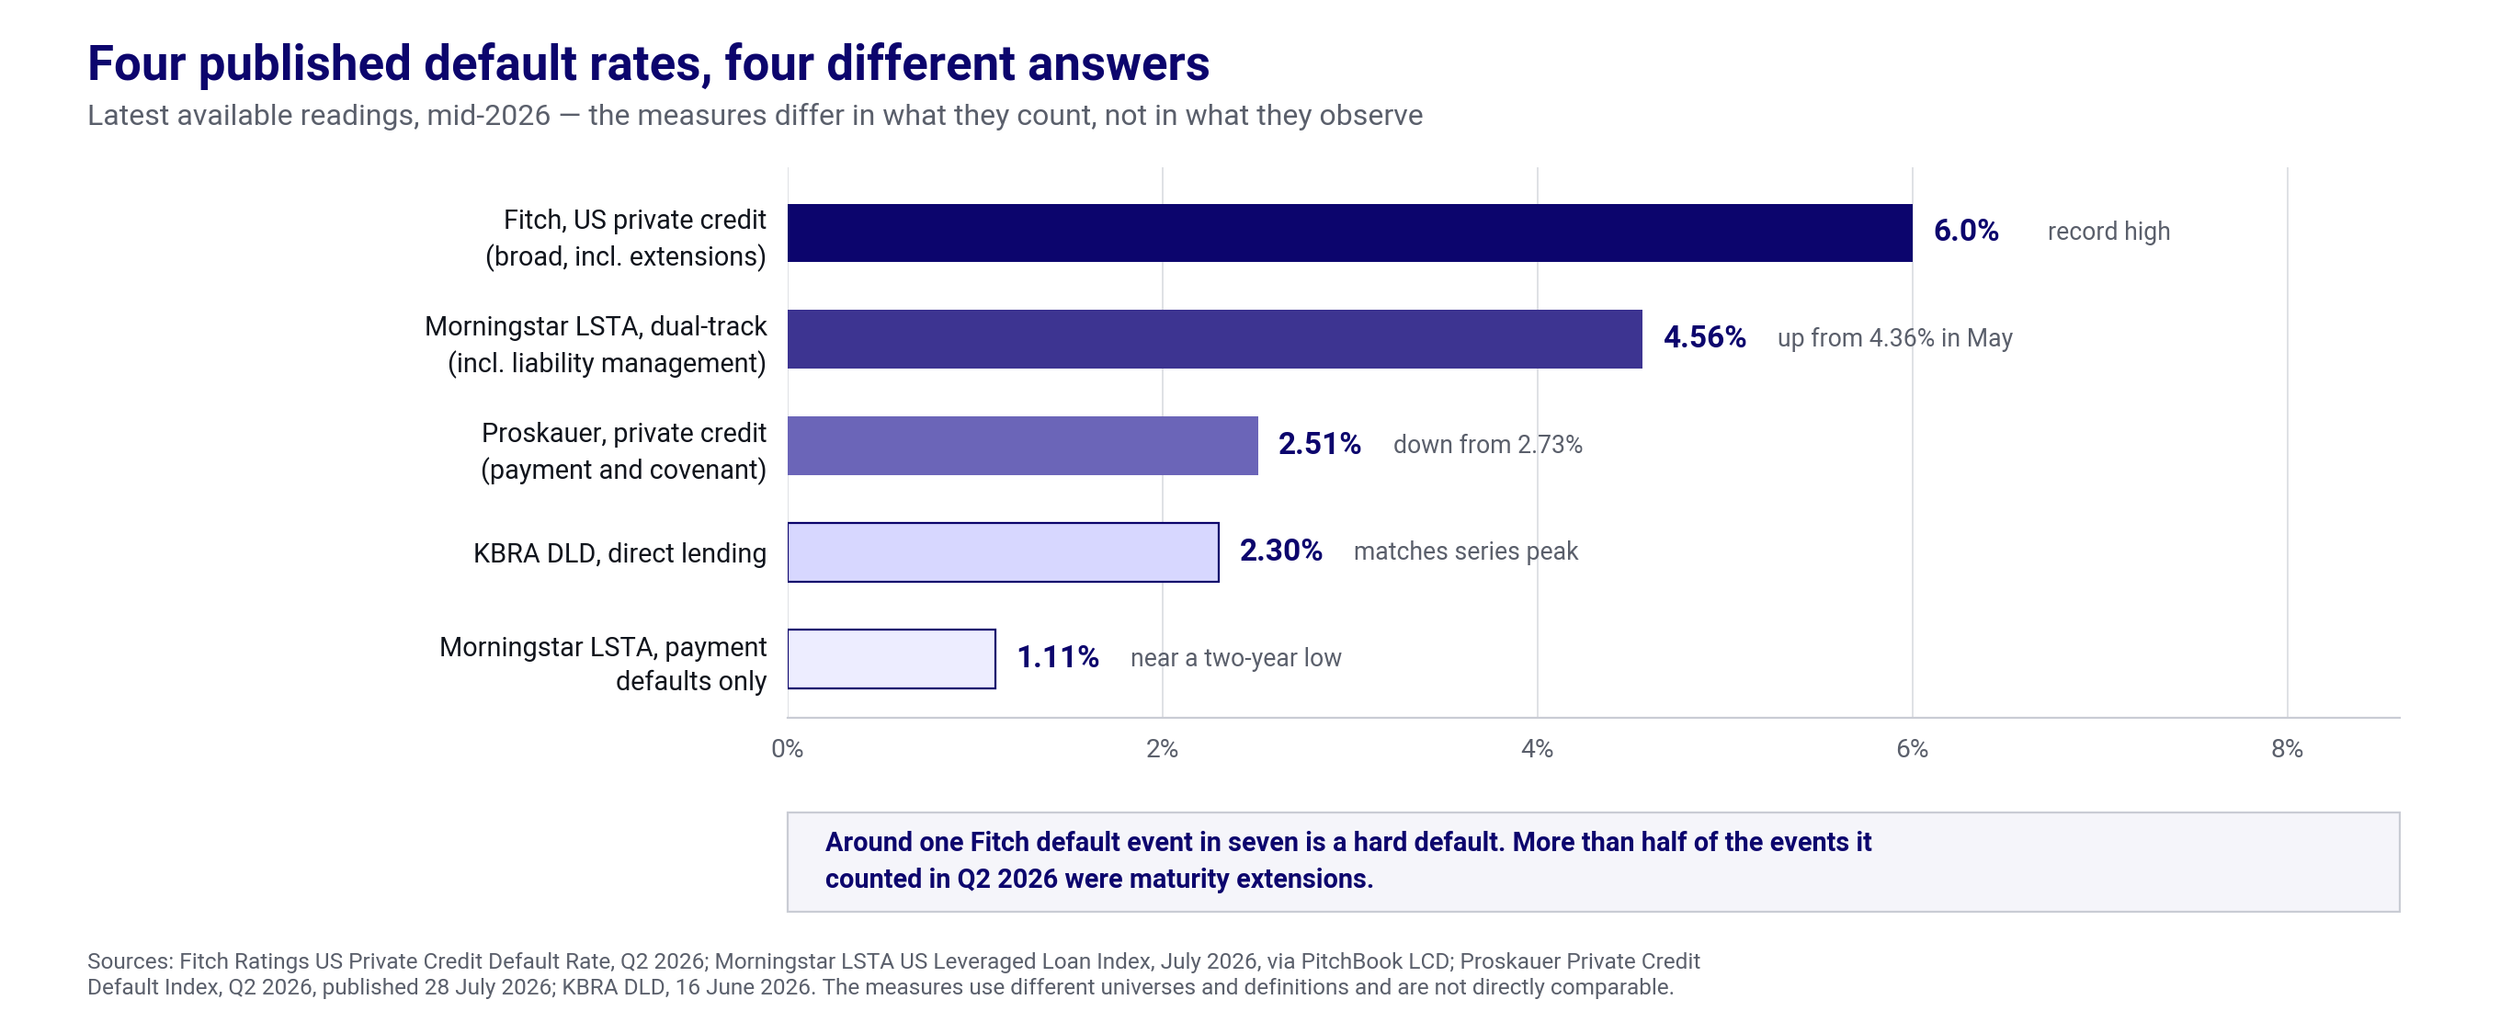
The public loan market makes the same point with better disclosure: the Morningstar LSTA index recorded a payment default rate of 1.11% in July against a dual-track rate of 4.56% including liability management exercises. A four-fold gap in the market where the data is cleanest is the clearest evidence available that resolution is being deferred rather than avoided.
Where the stress is going instead is enforcement and amendment. Lincoln International records US$39.4bn of debt foreclosed by lenders across 2025 and the early part of 2026, against US$13.6bn over the preceding three years combined. Around three-quarters of that cohort came from 2021 and 2022 vintage deals, and 37.5% of those companies had already received a sponsor equity infusion, at a median of US$15m, before the lender took the keys. In the fourth quarter of 2025 alone, amendment activity rose 13% quarter on quarter, maturity extensions 14%, covenant holidays 14% and sponsor infusions 31%. The structure permits it: the Financial Stability Board records borrowers carrying five to six times debt to EBITDA, or seven times if adjustments are stripped out, with around 12% of loans carrying payment-in-kind features and 10% of middle-market CLO borrowers unable to cover interest from cash flow. A structure with that much flexibility can carry a struggling borrower for a long time without producing a default event.
One reason resolution is deferred is that the exit market cannot clear the backlog even when it is working. 2025 was the second-best year for buyout exits on record at US$717bn and still left approximately 32,000 unexited companies worth approximately US$3.8trn, about five years of exits at that run rate. Loan-funded sponsor dividends rose from US$23.8bn in 2024 to US$44.1bn in 2025, and the maturity wall has been pushed into 2028 and 2029 rather than resolved.
3. Software Repriced Before Anything Defaulted
The largest concentration in private credit is a single sector. Software alone was 26.8% of Blackstone's credit fund at 31 March 2026, and software with health care technology and IT services was 37.0% on a derived basis, against S&P's 28.7% for software and affiliated sectors across more than 165 BDCs on the comparable definition. The Bank for International Settlements traces software-as-a-service direct loans from around US$8bn in 2015 to over US$500bn, or 19% of all direct loans, by the end of 2025. In the first quarter of 2026 that concentration repriced. Lincoln's index recorded a whole-portfolio valuation decline of 2.2% and a software decline of 8.8%, and between October 2025 and February 2026 software equities fell around 30% against around 10% for BDC equities. The vehicle with the largest software concentration received gross redemption requests of 40.7% of net assets in the first quarter and 38.1% in the second, the largest in the industry, though its net outflow after new subscriptions was around 2% of value.
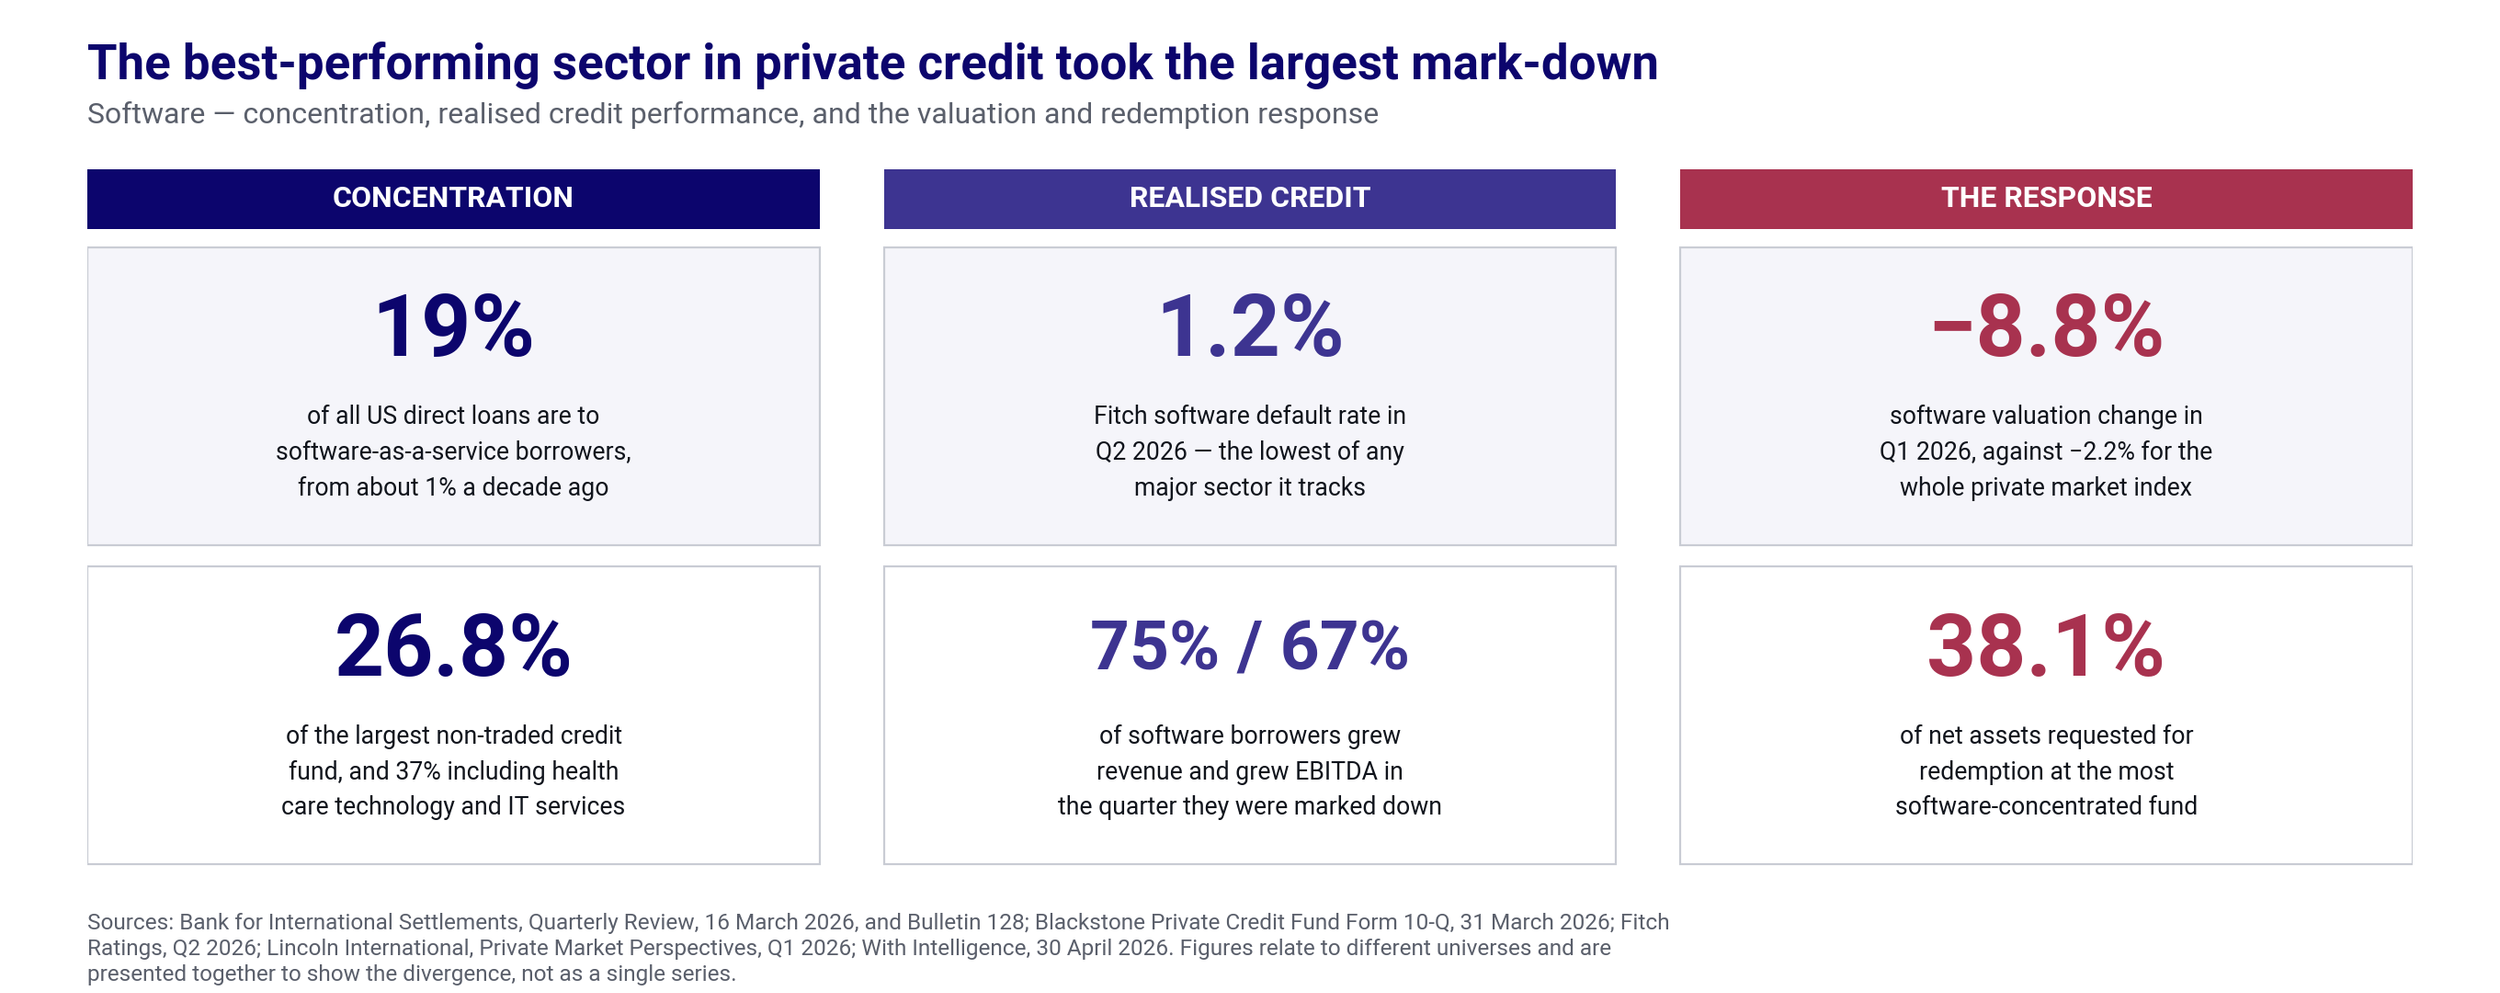
That fund's non-accruals stood at 0.2% of fair value at 31 March. Fitch's software default rate for the second quarter was 1.2%, the lowest of any major sector it tracks, and Lincoln found 74.9% of its software borrowers growing revenue and 67.0% growing EBITDA in the quarter their loans were marked down 8.8%. A little defaulted, including one of the two credits behind Blackstone's own non-accrual increase, but the repricing ran far ahead of realised losses. A fund's software percentage is a weak guide to how much of that repricing it absorbed: Blackstone reports its own software book underwritten at 37% loan-to-value against 41% portfolio-wide.
The reason it was violent is that the risk had never been charged for. BIS records that by late 2025 software, other information technology and non-technology borrowers were being charged broadly similar spreads, and that BDCs with high and low software exposure traded at similar price to dividend ratios with no discount for the concentration. There was no premium already in the price to absorb a change of view, so the whole adjustment arrived through the mark. The realised losses are elsewhere: Fitch's consumer products default rate rose from 6.1% in January 2025 to 12.8% in December, and industrials carried the highest rate among large sectors in the second quarter.
Where a loan is held by several lenders, the carrying value is a judgement, and the judgements diverge. On the dental services credit behind Blackstone's non-accrual increase, four lenders were carrying the same borrower at 96, 93, 80 and approximately 80 at 31 December 2025, a range of sixteen points at a single date. Roughly nine in ten co-held positions are marked within three points of each other, so dispersion is a feature of impaired credits rather than of these portfolios generally. Novarche takes no view on whether any mark is correct. Where exit is at estimated value, dispersion in the estimate is itself a liquidity variable, and it is widest exactly where the tail is deteriorating.
4. The Income Case Weakened at the Same Time
Private credit was bought by most of its 2021 to 2024 investors for a high, floating, senior secured coupon. On Lincoln's like-for-like new-issue data, unitranche spreads moved from SOFR plus 5.50% to 6.25% in the first quarter of 2024 to SOFR plus 4.75% to 5.50% two years later, with the base rate falling from 5.30% to 3.70%. The all-in yield went from approximately 11.8% to approximately 8.9%, of which around 160 basis points is the base rate, around 75 the contractual spread and the remaining 55 or so fees, discount and mix. Spread compression compounded the rate decline rather than cushioning it.
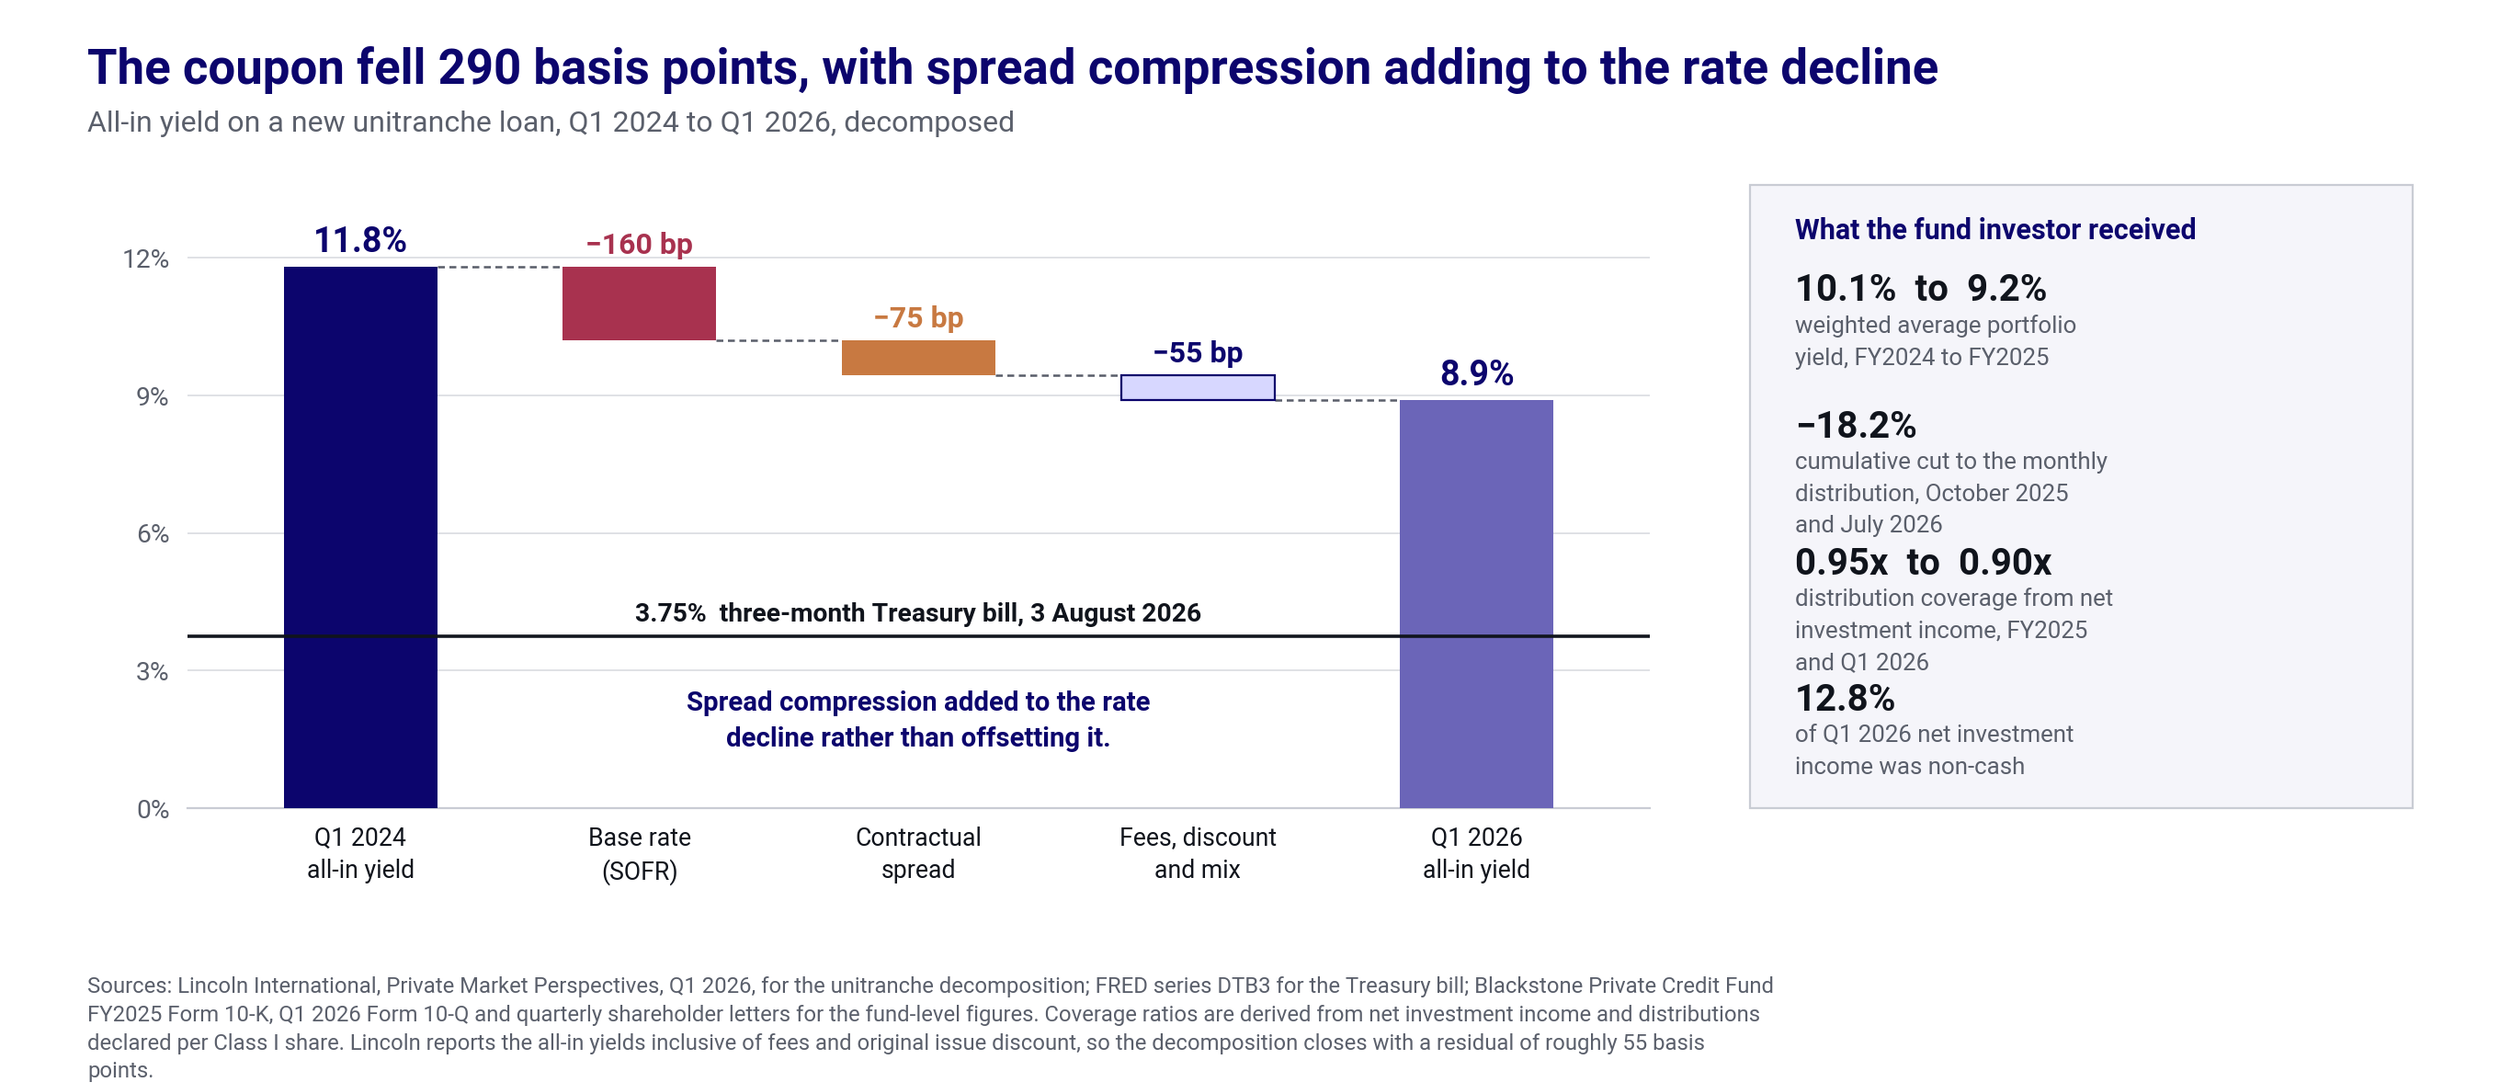
The comparison against cash has narrowed accordingly. The Federal Reserve has eased 175 basis points from its July 2023 peak and has not moved in 2026, holding for a fifth consecutive meeting on 29 July, and the three-month Treasury bill was 3.75% at the start of August. A new unitranche loan therefore offers around five points over a Treasury bill for a first-lien position in a company carrying five to six times leverage, against roughly six and a half points two years ago on a visibly healthier book.
At fund level, Blackstone's weighted average yield on performing debt fell from 10.1% in 2024 to 9.2% in 2025. The monthly distribution was cut twice, a cumulative reduction of 18.2%, and FY2025 was the first year the Class I distribution was not covered by net investment income, at 0.95 times, with the first quarter of 2026 at 0.90 times. In that quarter 7.0% of total investment income and approximately 12.8% of net investment income was non-cash. A distribution can therefore be covered on an accounting basis while being uncovered per share and in cash. The disclosure is accurate; the accounting test most investors rely on does not answer the question they think it answers.
5. What Follows, and What It Means Here
Southeast Asia's exposure to this is about funding rather than credit. We identified no publicly documented default, restructuring or workout of a named regional borrower to private credit lenders in 2025 or 2026, which is an absence of public evidence rather than a confirmed absence of stress. Around 90% of Asia-Pacific private credit deals are sponsorless, so the dependence on sponsor exits that drives the American repayment problem does not translate directly.
The funding side has moved sharply. Asia-focused private credit fundraising has gone from 53 funds and US$20.2bn in 2022 to 29 funds and US$9.5bn in 2025 and five funds and US$1.2bn in the first half of 2026, with investor preference for established United States managers cited as the driver rather than any deterioration in Asian credit. What has fallen by roughly 90% is the annual intake, not the pool available to lend, which is still projected to grow. The alternatives narrowed at the same time: Asia-Pacific ex-Japan syndicated loan issuance fell 15% to US$69bn in the first half, the weakest since 2010, and ASEAN corporate bond issuance fell 9.3% in the final quarter of 2025. A borrower planning a 2027 refinancing on the assumption that an incumbent lender can upsize should start the conversation two to three quarters earlier than planned, keep a bank track running in parallel, and test the case where that upsize does not come.
For sponsors and borrowers, the 2021 and 2022 vintages are the ones being enforced against, and more than a third of the companies foreclosed on had already written an equity cheque before the lender moved. An infusion buys time and, on that evidence, does not reliably change the outcome.
A word on proportion. The banking channel looks well insulated, with the European Central Bank's stress exercise finding bank losses not exceeding 1.3% of total equity under a severe combined default assumption, and the Federal Reserve noting in May that redemption requests had “remained manageable”. Its own account of what drove sentiment includes changes in interest rates and some defaults alongside concerns about asset quality. The adjustment is being borne by fund investors rather than by banks, which makes this a repricing and a test of liquidity terms. Advisers who describe it as a credit crisis will be wrong in a way that costs their clients options.
Conclusion
Several things moved together in private credit this year and the published measures could not separate them. Spreads widened and lowered every mark, the policy rate stopped falling and capped the coupon, and capital rotated toward real assets, while underneath all three a narrow tail of loans deteriorated sharply and the averages improved. An investor could see the aggregate without seeing the composition. Requests have since eased, and Blackstone reported in late July that third-quarter redemptions at its flagship credit fund were down materially. Whether that holds is not yet visible in published data, and it does not change the measurement problem. Rebuilding the measurement is the work.